Tuesday, February 19, 2013

Exploring VMware vSphere PowerCLI with F#

I was recently asked to vet some VMware cluster capacity numbers. It seemed like a task that might be repeated in the future and I really hate to manually transcribe the data and compare them. So that means I need to write a script to automate it. Fortunately, VMware has vSphere PowerCLI for this job. Unfortunately, the documentation for it was rather sparse. I also looked at the book VMware vSphere PowerCLI Reference: Automating vSphere Administration, but really did not want to script in PowerShell simply because I'm not that familiar with PowerShell. However, PowerCLI is accessible from .NET also, so I can write my script in F#.

The following lines of script simply drills down from Datacenter object to the VirtualMachine object. Once you grab all the objects, you can explore the properties of each object.

#r @"C:\pkg\VMware\Infrastructure\vSphere PowerCLI\VMware.Vim.dll"

open System
open VMware.Vim
open System.Collections.Specialized

let serviceUrl = "https://myVSphereHost/sdk"
let userId = "someUserId"
let password="somePassword"

let client = new VimClient()
let service = client.Connect(serviceUrl)

// Must login to do anything - if you are getting null values, it means the session automatically timed out
client.Login(userId,password)

// Let us get all the datacenters
let dataCenters = client.FindEntityViews(typeof<Datacenter>,null,null,null)

// Drill down into the first datacenter
let dc = dataCenters |> Seq.cast<Datacenter> |> Seq.head

// Get a cluster
let cluster = client.GetView(dc.Parent,null) :?> ClusterComputeResource

// Get the first host in the cluster
let host = client.GetView(cluster.Host |> Seq.head,null) :?> HostSystem

// Get the first VM on the physical host
let vm = client.GetView(host.Vm |> Seq.head,null) :?> VirtualMachine

Let's do something interesting with PowerCLI. In the following scripts, I wanted to grab the capacity information at the VMware cluster level and the combine allocation/utilization info of all the virtual machines hosted on the VMware cluster.


// Utility function to help use get vSphere Entities
let getEntityViews viewType searchParams =
    match searchParams with
    | Some(searchParams0) ->
        let filters = new NameValueCollection()
        searchParams0 |> Seq.iter (fun (k,v) -> filters.Add(k,v))
        client.FindEntityViews(viewType,null,filters,null) 

    | None ->
        client.FindEntityViews(viewType,null,null,null) 

// Get vSphere Entities with specific properties (reduces returned data)
// Don't know how to define a function with multiple arities in F# - clumsy workaround
let getEntityViews2 viewType searchParams props =
    match searchParams with
    | Some(searchParams0) ->
        let filters = new NameValueCollection()
        searchParams0 |> Seq.iter (fun (k,v) -> filters.Add(k,v))
        client.FindEntityViews(viewType,null,filters,props) 
    | None ->
        client.FindEntityViews(viewType,null,null,props) 


// Get Cluster usage summary!
let getUsageSummary clusterName =

    let clusterProps = [|"Summary"; "Host"|]
    let hostProps = [|"Vm";"Name";"Hardware";"Runtime"|]
    let vmProps = [|"Name";"Config";"Runtime";"Summary";"ResourceConfig"|]

    let toMB memoryInBytes = memoryInBytes / (1024L*1024L)

    // Get cluster - Expect only one result
    printfn "Getting cluster data..."
    let cluster = 
        let filters = Some([("name",clusterName)])
        getEntityViews2 typeof<ClusterComputeResource> filters clusterProps
            |> Seq.cast<ClusterComputeResource>
            |> Seq.head


    // Get all Hosts for this cluster
    printfn "Getting host list..."
    let hostList =
        cluster.Host
        |> Seq.map(fun moRef -> client.GetView(moRef,hostProps))
        |> Seq.cast<HostSystem>
        |> Seq.cache


    printfn "Getting VM list..."
    let vmList =
        hostList
        |> Seq.map (fun host -> host.Vm)
        |> Seq.concat
        |> Seq.map (fun moRef -> client.GetView(moRef,vmProps))
        |> Seq.cast<VirtualMachine>
        |> Seq.cache

    let clusterCores = cluster.Summary.NumCpuCores
    let clusterCPU = cluster.Summary.TotalCpu
    let clusterMemory = cluster.Summary.TotalMemory


    // Utility function to get summation results from selected fields
    let inline total (extractor:VirtualMachine -> Nullable<'b>) =
        vmList
        |> Seq.map extractor
        |> Seq.map (fun x -> x.GetValueOrDefault())
        |> Seq.sum


    printfn "Getting Cluster Summary Info..."
    let cpuUsed        = total (fun vm -> vm.Summary.Config.NumCpu)
    let memoryUsed     = total (fun vm -> vm.Summary.Config.MemorySizeMB)
    let cpuReserved    = total (fun vm -> vm.Summary.Config.CpuReservation)
    let memoryReserved = total (fun vm -> vm.Summary.Config.MemoryReservation)
    let maxMemoryUsage = total (fun vm -> vm.Runtime.MaxMemoryUsage)
    let maxCpuUsage    = total (fun vm -> vm.Runtime.MaxCpuUsage)

    let cpuReservation    = total (fun vm -> vm.ResourceConfig.CpuAllocation.Reservation) 
    let cpuLimit          = total (fun vm -> vm.ResourceConfig.CpuAllocation.Limit) 
    let memoryReservation = total (fun vm -> vm.ResourceConfig.MemoryAllocation.Reservation)
    let memoryLimit       = total (fun vm -> vm.ResourceConfig.MemoryAllocation.Limit) 

    
    printfn "Cluster Name               : %s" clusterName
    printfn "Number of Hosts in Cluster : %i" (Seq.length hostList)
    printfn "Number of VMs in Cluster   : %i" (Seq.length vmList)
    printfn "Cluster Total Cores        : %i" clusterCores
    printfn "Cluster Total CPU (MHz)    : %i" clusterCPU
    printfn "Cluster Total Memory       : %i" clusterMemory
    printfn "Cluster Total Memory (MB)  : %i" (toMB clusterMemory)
    printfn "CPU Used by VMs            : %i" cpuUsed
    printfn "Memory Used by VMs         : %i" memoryUsed
    printfn "CPU Reserved by VMs        : %i" cpuReserved
    printfn "Memory Reserved by VMs     : %i" memoryReserved
    printfn "Max Memory Usage by VMs    : %i" maxMemoryUsage
    printfn "Max CPU Usage by VMs (MHz) : %i" maxCpuUsage
    printfn "Total Allocated CPU Reservations    : %i" cpuReservation
    printfn "Total Allocated CPU Limits          : %i" cpuLimit
    printfn "Total Allocated Memory Reservations : %i" memoryReservation
    printfn "Total Allocated Memory Limits       : %i" memoryLimit
    printfn "Memory Used / Cluster Total Memory  : %f" (double(memoryUsed) / double(toMB clusterMemory))
    printfn "vCPU Allocated / Cluster Total Cores : %f" (float(cpuUsed) / float(clusterCores))    
    printfn "Done!"

// Invoke getUsageSummary to get the summary info on my cluster
getUsageSummary "MyTestCluster"

Sample results:

Number of Hosts in Cluster : 5
Number of VMs in Cluster   : 10
Cluster Total Cores        : 120
Cluster Total CPU (MHz)    : 276000
Cluster Total Memory       : 1374369136640
Cluster Total Memory (MB)  : 1310700
CPU Used by VMs            : 38
Memory Used by VMs         : 253952
CPU Reserved by VMs        : 0
Memory Reserved by VMs     : 0
Max Memory Usage by VMs    : 253952
Max CPU Usage by VMs (MHz) : 87400
Total Allocated CPU Reservations    : 0
Total Allocated CPU Limits          : -10
Total Allocated Memory Reservations : 0
Total Allocated Memory Limits       : -10
Memory Used / Cluster Total Memory  : 0.193753
vCPU Allocated / Cluster Total Cores : 0.316667

I wish VMware had PowerCLI class documentation similar to those for the .NET library hosted on MSDN. If VMware does have those documentation, I can't seem to find them. Lack of documentation has forced me to interactively explore the PowerCLI with F#. Thankfully, I can do this in F# and shudder at the thought of exploring PowerCLI in C#.
Friday, February 08, 2013

Clojure Script to Convert Java GC log to CSV Format

My previous blog post showed how to use R to perform Java GC log analysis. Ajit Joglekar asked that I post the Clojure script. Here's the Clojure script that I used to convert GC log to CSV format. I have not tested this with a wide variety of GC logs but I do know that this script will not work for CMS or G1GC gc logs. Modify minor-gc-pattern and full-gc-pattern to match the gc log output as needed.


(use '[clojure.string :only (join)])  

; Match for pause time "0.1566980 secs]"
(def ^:constant pause-time "([\\d\\.]+) secs\\]")

; Match for Java heap space stat "524288K->32124K(2009792K)"
(def ^:constant space "(\\d+)K->(\\d+)K\\((\\d+)K\\)")

; Match for Execution stat "[Times: user=0.24 sys=0.06, real=0.16 secs]"
(def ^:constant exec-stat " \\[Times: user=([\\d\\.]+) sys=([\\d\\.]+), real=([\\d\\.]+) secs\\]")

; Example Minor GC entry   
; 212.785: [GC [PSYoungGen: 524288K->32124K(611648K)] 524288K->32124K(2009792K), 0.1566980 secs] [Times: user=0.24 sys=0.06, real=0.16 secs] 
; Define regex pattern to parse young gen GC event
(defn minor-gc-pattern []
  (let [timestamp  "([\\d\\.]+): \\[GC .*\\[PS.*: "
        young-gen   (str space "] ")
        heap        (str space ", ")]
    (re-pattern (str timestamp young-gen  heap pause-time exec-stat))))                

; Example Full GC entry   
;"43587.513: [Full GC (System) [PSYoungGen: 964K->0K(598912K)] [PSOldGen: 142673K->120674K(1398144K)] 143637K->120674K(1997056K) [PSPermGen: 82179K->82179K(147520K)], 0.7556570 secs] [Times: user=0.76 sys=0.00, real=0.77 secs]"
; Define the regex pattern to parse each line in gc log
(defn full-gc-pattern []
    (let [timestamp   "([\\d\\.]+): \\[Full.*"
          young-gen  (str ": " space "]")
          old-gen    (str " \\[\\w+: " space "\\] ")
          perm-gen   (str " \\[\\w+: "space "\\], ")
          heap       space]
         (re-pattern (str timestamp 
                          young-gen 
                          old-gen 
                          heap 
                          perm-gen 
                          pause-time 
                          exec-stat))))                
 
; Variable definitions (for both process-full-gc & process-minor-gc
;     ts - timestamp (in seconds)
;     ys - YoungGen space starting heap size (in KB)
;     ye - YoungGen space ending heap size (in KB)
;     ym - YoungGen space max heap size (in KB)
;     os - OldGen space starting heap size (in KB)
;     oe - OldGen space ending heap size (in KB)
;     om - OldGen space max heap size (in KB)
;     hs - Total heap space starting heap size (in KB)
;     he - Total heap space ending heap size (in KB)
;     hm - Total heap space max heap size (in KB)
;     pt - GC Pause Time (in seconds)
;     ps - PermGen space starting heap size (in KB)
;     pe - PermGen space ending heap size (in KB)
;     pm - PermGen space max heap size (in KB)
;     ut - User Time (in seconds)
;     kt - Kernel Time (in seconds)
;     rt - Real Time (in seconds)
(defn process-full-gc [entry]
  (let [[a ts ys ye ym os oe om hs he hm ps pe pm pt ut kt rt & e] entry]
    (join \, [ts "full" pt 
              ys ye ym 
              hs he hm 
              ut kt rt 
              os oe om 
              ps pe pm])))
   
(defn process-minor-gc [entry]
  (let [[a ts ys ye ym hs he hm pt ut kt rt & e] entry]
    (join \, [ts "minor" pt 
              ys ye ym 
              hs he hm 
              ut kt rt])))

(def headers (join \,  ["timestamp" "gc.type" "pause.time"
                        "young.start" "young.end" "young.max"
                        "heap.start" "heap.end" "heap.max"
                        "time.user" "time.sys" "time.real"
                        "old.start" "old.end" "old.max"
                        "perm.start" "perm.end" "perm.max"]))    
       

(defn process-gc-file [infile outfile]
  (let [gcdata (line-seq (clojure.java.io/reader (clojure.java.io/file infile)))]
    (with-open [w (clojure.java.io/writer outfile)]
      (let [writeln (fn [x] (.write w (str x "\n")))]
        (writeln headers)
        (doseq [line gcdata]
          (let [minor-gc (re-seq (minor-gc-pattern) line)
                full-gc  (re-seq (full-gc-pattern) line)]
            (when-not (nil? full-gc) 
              (writeln (process-full-gc (first full-gc))))
            (when-not (nil? minor-gc) 
              (writeln (process-minor-gc (first minor-gc))))))))))

;-----------------------------------------------------------------------   
; Convert Java GC log csv format
;-----------------------------------------------------------------------    
(process-gc-file "gc.log" "data.csv")

You can download the script directly here : gcanalysis.clj.

Monday, February 04, 2013

Java Garbage Collection Log Analysis with R

In the past, I generally perform Java GC log analysis using a combination of scripts such as the one I have written in my previous blog post for parsing the gc log and transforming it into csv format, GCHisto tool as mentioned in the book Java Performance, and Microsoft Excel for mostly plotting purposes. However, as I find myself doing more and more GC analysis for troubleshooting performance issues, I'm finding that these tools are not flexible enough for my purposes.

I heard about The R Project from one my coworker. In addition, I see R gaining traction in the industry; I decided to try using R for GC analysis. This blog post is to document some of my experiences with using R for GC analysis.

There are some posts in the blogosphere that seem to suggest that it is difficult to learn R. I did not find that to be the case. Whether that's due to knowing functional programming or past experience with Matlab, I don't know. I did purchase a bunch of books on R to learn it including R in a Nutshell, R by Example, R in Action, Introductory Statistics with R. I got the most mileage with the last book.

In working with R, I still would use a script to parse out raw GC log and converted into csv file. So far, most of my GC analysis are on non-CMS GC logs so this blog post is restricted to discussing analysis of mostly parallel GC logs. In order to be able to better read my R scripts, I have changed my script to output the csv file with the following headers:

timestamp,gc.type,young.start,young.end,young.max,heap.start,heap.end,heap.max,pause.time,old.start,old.end,old.max,perm.start,perm.end,perm.max,time.user,time.sys,time.real

I can load the csv file in R as follows:

data.file <- "gc.log.csv"
data.gc <- read.csv(data.file,sep=',')

I created the following utility functions because I find that I often want to work in MB or GB for heap space rather than in KB. Also, I want to work with timestamp in hours rather than seconds.

sec.to.hours  <- function(x) x/(60.0*60.0)
kb.to.mb <- function(x) x/1024.0
kb.to.gb <- function(x) x/1024.0^2

Printing GC Pause Time Statistics

With this, I can dump the GC pause time statistical information as follows:

# Dump mean, standard deviation, GC counts for GC pause time
attach(data.gc)
 by(pause.time,gc.type,mean)
 by(pause.time,gc.type,sd)
 by(pause.time,gc.type,length)

 # GC Frequency statistics
 summary(diff(timestamp))

 # Time spent in GC
 sum(pause.time)

 # Percentage of time spent in GC
 sum(pause.time)*100.0/max(timestamp)
 
detach(data.gc)

For the above code, a sample output would be:

# by(pause.time,gc.type,mean) output 
# GC Average Pause Time
gc.type: full
[1] 2.125116
-------------------------------------------------------------- 
gc.type: minor
[1] 0.06472383

# by(pause.time,gc.type,sd) output 
# GC pause time distribution
gc.type: full
[1] 1.01972
-------------------------------------------------------------- 
gc.type: minor
[1] 0.02684703

# by(pause.time,gc.type,length) output 
# GC count by type
gc.type: full
[1] 7
-------------------------------------------------------------- 
gc.type: minor
[1] 2172

# summary(diff(timestamp)) output 
# GC Frequency statistics - (e.g. GC occurs on average every 84 seconds)
   Min. 1st Qu.  Median    Mean 3rd Qu.    Max. 
   0.08   22.44   71.34   84.83  143.10  252.90 
   
# sum(pause.time) output
# Total time spent in GC   
[1] 155.456

# sum(pause.time)*100.0/max(timestamp) output 
# Percentage of time spent in GC
[1] 0.08412511

Plotting GC Timeline

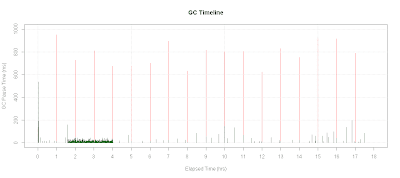
Here's how to plot GC Timeline:

with(data.gc, {
 plot.title <-"GC Timeline"
 gc.minor <- pause.time[gc.type == "minor"]
 gc.full <- pause.time[gc.type == "full"]

 # Plot bars for full GC pause time 
 plot(sec.to.hours(timestamp[gc.type == "full"]),
   gc.full*1000.0,
   xlab="Elapsed Time (hrs)",
   ylab="GC Pause Time Time(ms)",type='h',
   main=plot.title,col="red",ylim=c(0,1000),xlim=c(0,18))
   
 # Plot bars for minor GC pause time
 lines(sec.to.hours(timestamp[gc.type == "minor"]),
       gc.minor*1000.0,col="dark green",type="h")

 # Set tick marks for every hour
 axis(1,seq(0,18,1))
 grid()
})

A sample output of the above code would be:

Plotting GC Pause Time Distribution

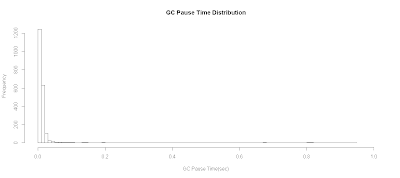
To plot GC pause time distribution:

# Plot GC Pause Time Distribution
plot.title <- "GC Pause Time Distribution"
with(data.gc, {
 hist(pause.time,breaks=100, 
   xlab="GC Pause Time(sec)",
   xlim=c(0,1.0),
   main=plot.title)
})

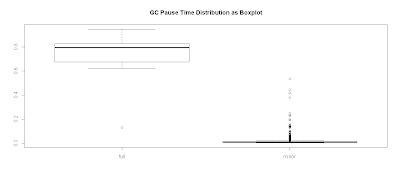
Plotting GC Pause Time Distribution as a Boxplot

Alternatively, you can view this as a boxplot:

plot.title <- "GC Pause Time Distribution as Boxplot"
with(data.gc, {
 boxplot(pause.time ~ gc.type,main=plot.title)
}) 

Plotting Promoted Heap Memory

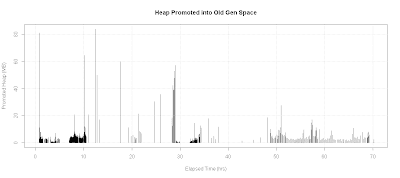
One particular case, I was analyzing a situation where minor GC pause time was unusually large. My original hypothesis is that a lot of memory was being promoted into old generation space. Therefore, I wanted a plot of heap memory promoted into old gen space:

plot.title <- "Heap Promoted into Old Gen Space"
with(data.gc, {
 old.end <- kb.to.mb(heap.end - young.end)
 x <- sec.to.hours(timestamp)
 # If there is a full GC, promoted heap size would go negative
 y <- diff(old.end)
 plot(x[-1],y,
   xlab="Elapsed Time (hrs)",
   ylab="Promoted Heap (MB)",type='h',
   main=plot.title)
 grid()
})

In this particular case, the promoted heap was not all that large as shown in the diagram below:

Plotting Young Gen Survived Heap

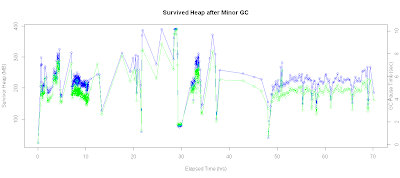
I then investigated survivor heap spaces. Here's the script that plots the survivor heap space along with GC pause time on the same chart:

# Plot survived Heap
xtitle <- 'Elapsed Time (hrs)'
ytitle <-'Survivor Heap (MB)'
plot.title <- "Survived Heap after Minor GC"

with(data.gc, {
   
 x <- sec.to.hours(timestamp)
 y <- kb.to.mb(young.end)
 plot(x,y,
  xlab=xtitle,ylab=ytitle,
  main=plot.title,type='o',col='blue')
  
 # Plot on secondary axis
 par(new=TRUE)
 plot(x,pause.time,
   axes=FALSE,type='o',
   col="green",pch=23,xlab="",ylab="")
 axis(4)
 mtext("GC Pause Time (sec)",4)
})

In addition, I can also check the correlation coefficient via :

> with(data.gc,cor(young.end[gc.type == 'minor'],pause.time[gc.type == 'minor']))
[1] 0.9659936

As we can see from the result, the correlation was pretty high that size of the survivor heap and its effect on GC pause time.

Checking for Memory Leaks

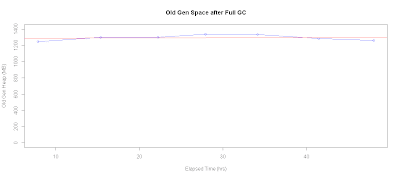
Another plot that I often have to generate is used as a quick check for memory leaks. Here's the R script that plots old gen heap space usage after every full GC:

# Check for memory leak
xtitle <- 'Elapsed Time (hrs)'
ytitle <-'Old Gen Heap (MB)'


with(data.gc, {
 plot.title <- "Old Gen Space after Full GC"
 x <- sec.to.hours(timestamp[gc.type=="full"])
 y <- kb.to.mb(old.end[gc.type=="full"])
 plot(x,y,
   xlab=xtitle,ylab=ytitle,main=plot.title,type='o',col='blue')

 # Add fitted line
 abline(lm(y ~ x),col="red")
 retval <<- lm(y ~ x)
})
retval

With the trend analysis line, we can potentially project when the system will run out of memory. For the following plot, checking the linear model fit along with eyeballing the chart suggests that we don't really have a memory leak issue:

Call:
lm(formula = y ~ x)

Coefficients:
(Intercept)            x  
   1285.978        0.298  

I am delighted by the power afforded by R to perform GC analysis. It has now become my preferred tool to perform GC analysis. In addition, because I learned how to use R, I'm beginning to use R in other capacity, including inventory , trending, and capacity planning analysis.