In the past, I generally perform Java GC log analysis using a combination of scripts such as the one I have written in my previous blog post for parsing the gc log and transforming it into csv format, GCHisto tool as mentioned in the book Java Performance, and Microsoft Excel for mostly plotting purposes. However, as I find myself doing more and more GC analysis for troubleshooting performance issues, I'm finding that these tools are not flexible enough for my purposes.
I heard about The R Project from one my coworker. In addition, I see R gaining traction in the industry; I decided to try using R for GC analysis. This blog post is to document some of my experiences with using R for GC analysis.
There are some posts in the blogosphere that seem to suggest that it is difficult to learn R. I did not find that to be the case. Whether that's due to knowing functional programming or past experience with Matlab, I don't know. I did purchase a bunch of books on R to learn it including R in a Nutshell, R by Example, R in Action, Introductory Statistics with R. I got the most mileage with the last book.
In working with R, I still would use a script to parse out raw GC log and converted into csv file. So far, most of my GC analysis are on non-CMS GC logs so this blog post is restricted to discussing analysis of mostly parallel GC logs. In order to be able to better read my R scripts, I have changed my script to output the csv file with the following headers:
timestamp,gc.type,young.start,young.end,young.max,heap.start,heap.end,heap.max,pause.time,old.start,old.end,old.max,perm.start,perm.end,perm.max,time.user,time.sys,time.real
I can load the csv file in R as follows:
data.file <- "gc.log.csv"
data.gc <- read.csv(data.file,sep=',')
I created the following utility functions because I find that I often want to work in MB or GB for heap space rather than in KB. Also, I want to work with timestamp in hours rather than seconds.
sec.to.hours  <- function(x) x/(60.0*60.0)
kb.to.mb <- function(x) x/1024.0
kb.to.gb <- function(x) x/1024.0^2
Printing GC Pause Time Statistics
With this, I can dump the GC pause time statistical information as follows:
# Dump mean, standard deviation, GC counts for GC pause time
attach(data.gc)
 by(pause.time,gc.type,mean)
 by(pause.time,gc.type,sd)
 by(pause.time,gc.type,length)

 # GC Frequency statistics
 summary(diff(timestamp))

 # Time spent in GC
 sum(pause.time)

 # Percentage of time spent in GC
 sum(pause.time)*100.0/max(timestamp)

detach(data.gc)
For the above code, a sample output would be:
# by(pause.time,gc.type,mean) output
# GC Average Pause Time
gc.type: full
[1] 2.125116
--------------------------------------------------------------
gc.type: minor
[1] 0.06472383

# by(pause.time,gc.type,sd) output
# GC pause time distribution
gc.type: full
[1] 1.01972
--------------------------------------------------------------
gc.type: minor
[1] 0.02684703

# by(pause.time,gc.type,length) output
# GC count by type
gc.type: full
[1] 7
--------------------------------------------------------------
gc.type: minor
[1] 2172

# summary(diff(timestamp)) output
# GC Frequency statistics - (e.g. GC occurs on average every 84 seconds)
   Min. 1st Qu.  Median    Mean 3rd Qu.    Max.
   0.08   22.44   71.34   84.83  143.10  252.90

# sum(pause.time) output
# Total time spent in GC
[1] 155.456

# sum(pause.time)*100.0/max(timestamp) output
# Percentage of time spent in GC
[1] 0.08412511
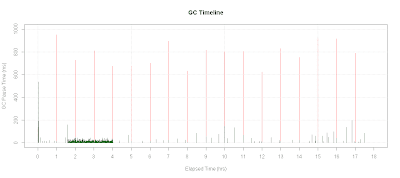
Plotting GC Timeline
Here's how to plot GC Timeline:
with(data.gc, {
 plot.title <-"GC Timeline"
 gc.minor <- pause.time[gc.type == "minor"]
 gc.full <- pause.time[gc.type == "full"]

 # Plot bars for full GC pause time
 plot(sec.to.hours(timestamp[gc.type == "full"]),
   gc.full*1000.0,
   xlab="Elapsed Time (hrs)",
   ylab="GC Pause Time Time(ms)",type='h',
   main=plot.title,col="red",ylim=c(0,1000),xlim=c(0,18))

 # Plot bars for minor GC pause time
 lines(sec.to.hours(timestamp[gc.type == "minor"]),
       gc.minor*1000.0,col="dark green",type="h")

 # Set tick marks for every hour
 axis(1,seq(0,18,1))
 grid()
})
A sample output of the above code would be:
Plotting GC Pause Time Distribution
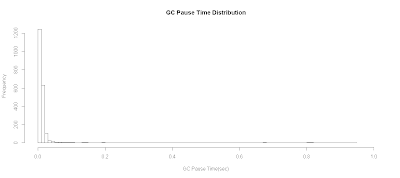
To plot GC pause time distribution:
# Plot GC Pause Time Distribution
plot.title <- "GC Pause Time Distribution"
with(data.gc, {
 hist(pause.time,breaks=100,
   xlab="GC Pause Time(sec)",
   xlim=c(0,1.0),
   main=plot.title)
})
Plotting GC Pause Time Distribution as a Boxplot
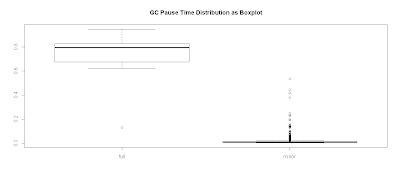
Alternatively, you can view this as a boxplot:
plot.title <- "GC Pause Time Distribution as Boxplot"
with(data.gc, {
 boxplot(pause.time ~ gc.type,main=plot.title)
})
Plotting Promoted Heap Memory
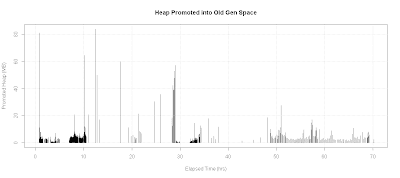
One particular case, I was analyzing a situation where minor GC pause time was unusually large. My original hypothesis is that a lot of memory was being promoted into old generation space. Therefore, I wanted a plot of heap memory promoted into old gen space:
plot.title <- "Heap Promoted into Old Gen Space"
with(data.gc, {
 old.end <- kb.to.mb(heap.end - young.end)
 x <- sec.to.hours(timestamp)
 # If there is a full GC, promoted heap size would go negative
 y <- diff(old.end)
 plot(x[-1],y,
   xlab="Elapsed Time (hrs)",
   ylab="Promoted Heap (MB)",type='h',
   main=plot.title)
 grid()
})
In this particular case, the promoted heap was not all that large as shown in the diagram below:
Plotting Young Gen Survived Heap
I then investigated survivor heap spaces. Here's the script that plots the survivor heap space along with GC pause time on the same chart:
# Plot survived Heap
xtitle <- 'Elapsed Time (hrs)'
ytitle <-'Survivor Heap (MB)'
plot.title <- "Survived Heap after Minor GC"

with(data.gc, {

 x <- sec.to.hours(timestamp)
 y <- kb.to.mb(young.end)
 plot(x,y,
  xlab=xtitle,ylab=ytitle,
  main=plot.title,type='o',col='blue')

 # Plot on secondary axis
 par(new=TRUE)
 plot(x,pause.time,
   axes=FALSE,type='o',
   col="green",pch=23,xlab="",ylab="")
 axis(4)
 mtext("GC Pause Time (sec)",4)
})
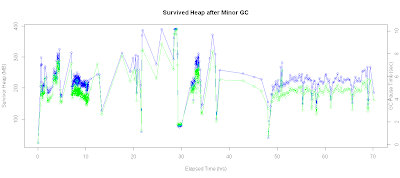
In addition, I can also check the correlation coefficient via :
> with(data.gc,cor(young.end[gc.type == 'minor'],pause.time[gc.type == 'minor']))
[1] 0.9659936
As we can see from the result, the correlation was pretty high that size of the survivor heap and its effect on GC pause time.
Checking for Memory Leaks
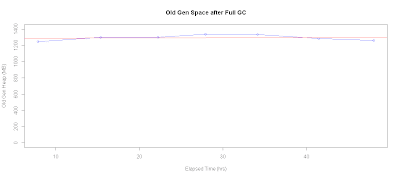
Another plot that I often have to generate is used as a quick check for memory leaks. Here's the R script that plots old gen heap space usage after every full GC:
# Check for memory leak
xtitle <- 'Elapsed Time (hrs)'
ytitle <-'Old Gen Heap (MB)'


with(data.gc, {
 plot.title <- "Old Gen Space after Full GC"
 x <- sec.to.hours(timestamp[gc.type=="full"])
 y <- kb.to.mb(old.end[gc.type=="full"])
 plot(x,y,
   xlab=xtitle,ylab=ytitle,main=plot.title,type='o',col='blue')

 # Add fitted line
 abline(lm(y ~ x),col="red")
 retval <<- lm(y ~ x)
})
retval
With the trend analysis line, we can potentially project when the system will run out of memory. For the following plot, checking the linear model fit along with eyeballing the chart suggests that we don't really have a memory leak issue:
Call:
lm(formula = y ~ x)

Coefficients:
(Intercept)            x
   1285.978        0.298
I am delighted by the power afforded by R to perform GC analysis. It has now become my preferred tool to perform GC analysis. In addition, because I learned how to use R, I'm beginning to use R in other capacity, including inventory , trending, and capacity planning analysis.


6 comments:
Hi John,
This looks like a flexible and powerful approach for GC log analysis. Thanks for sharing it. Could you please also share the clojure script used for generating the csv file?
TIA
Cheers,
-Ajit
The chewiebug GC Viewer has a very good GC log parser in it, and you can export whatever it parses (including log files for every current Oracle JVM collector - e.g. CMS, G1) and have it spit out CSV for you
Great article. Nice to see data tools being applied to tech problems in a practical manner. I'll definitely make use of some of these snippets.
I like your blog a lot. Its informative and full of information. Thank you for sharing.
Usefull information, Interesting. GCeasy is a tool that analyzes logs related to garbage collection. It is an easy way to detect memory leak problems as it goes through and analyze garbage collection logs. Another reason to use GCeasy is that it is available online; there is no need for you to install it on your machine to use it.
Great readding your post
Post a Comment