Showing posts with label java. Show all posts

Friday, February 08, 2013

Clojure Script to Convert Java GC log to CSV Format

My previous blog post showed how to use R to perform Java GC log analysis. Ajit Joglekar asked that I post the Clojure script. Here's the Clojure script that I used to convert GC log to CSV format. I have not tested this with a wide variety of GC logs but I do know that this script will not work for CMS or G1GC gc logs. Modify minor-gc-pattern and full-gc-pattern to match the gc log output as needed.


(use '[clojure.string :only (join)])  

; Match for pause time "0.1566980 secs]"
(def ^:constant pause-time "([\\d\\.]+) secs\\]")

; Match for Java heap space stat "524288K->32124K(2009792K)"
(def ^:constant space "(\\d+)K->(\\d+)K\\((\\d+)K\\)")

; Match for Execution stat "[Times: user=0.24 sys=0.06, real=0.16 secs]"
(def ^:constant exec-stat " \\[Times: user=([\\d\\.]+) sys=([\\d\\.]+), real=([\\d\\.]+) secs\\]")

; Example Minor GC entry   
; 212.785: [GC [PSYoungGen: 524288K->32124K(611648K)] 524288K->32124K(2009792K), 0.1566980 secs] [Times: user=0.24 sys=0.06, real=0.16 secs] 
; Define regex pattern to parse young gen GC event
(defn minor-gc-pattern []
  (let [timestamp  "([\\d\\.]+): \\[GC .*\\[PS.*: "
        young-gen   (str space "] ")
        heap        (str space ", ")]
    (re-pattern (str timestamp young-gen  heap pause-time exec-stat))))                

; Example Full GC entry   
;"43587.513: [Full GC (System) [PSYoungGen: 964K->0K(598912K)] [PSOldGen: 142673K->120674K(1398144K)] 143637K->120674K(1997056K) [PSPermGen: 82179K->82179K(147520K)], 0.7556570 secs] [Times: user=0.76 sys=0.00, real=0.77 secs]"
; Define the regex pattern to parse each line in gc log
(defn full-gc-pattern []
    (let [timestamp   "([\\d\\.]+): \\[Full.*"
          young-gen  (str ": " space "]")
          old-gen    (str " \\[\\w+: " space "\\] ")
          perm-gen   (str " \\[\\w+: "space "\\], ")
          heap       space]
         (re-pattern (str timestamp 
                          young-gen 
                          old-gen 
                          heap 
                          perm-gen 
                          pause-time 
                          exec-stat))))                
 
; Variable definitions (for both process-full-gc & process-minor-gc
;     ts - timestamp (in seconds)
;     ys - YoungGen space starting heap size (in KB)
;     ye - YoungGen space ending heap size (in KB)
;     ym - YoungGen space max heap size (in KB)
;     os - OldGen space starting heap size (in KB)
;     oe - OldGen space ending heap size (in KB)
;     om - OldGen space max heap size (in KB)
;     hs - Total heap space starting heap size (in KB)
;     he - Total heap space ending heap size (in KB)
;     hm - Total heap space max heap size (in KB)
;     pt - GC Pause Time (in seconds)
;     ps - PermGen space starting heap size (in KB)
;     pe - PermGen space ending heap size (in KB)
;     pm - PermGen space max heap size (in KB)
;     ut - User Time (in seconds)
;     kt - Kernel Time (in seconds)
;     rt - Real Time (in seconds)
(defn process-full-gc [entry]
  (let [[a ts ys ye ym os oe om hs he hm ps pe pm pt ut kt rt & e] entry]
    (join \, [ts "full" pt 
              ys ye ym 
              hs he hm 
              ut kt rt 
              os oe om 
              ps pe pm])))
   
(defn process-minor-gc [entry]
  (let [[a ts ys ye ym hs he hm pt ut kt rt & e] entry]
    (join \, [ts "minor" pt 
              ys ye ym 
              hs he hm 
              ut kt rt])))

(def headers (join \,  ["timestamp" "gc.type" "pause.time"
                        "young.start" "young.end" "young.max"
                        "heap.start" "heap.end" "heap.max"
                        "time.user" "time.sys" "time.real"
                        "old.start" "old.end" "old.max"
                        "perm.start" "perm.end" "perm.max"]))    
       

(defn process-gc-file [infile outfile]
  (let [gcdata (line-seq (clojure.java.io/reader (clojure.java.io/file infile)))]
    (with-open [w (clojure.java.io/writer outfile)]
      (let [writeln (fn [x] (.write w (str x "\n")))]
        (writeln headers)
        (doseq [line gcdata]
          (let [minor-gc (re-seq (minor-gc-pattern) line)
                full-gc  (re-seq (full-gc-pattern) line)]
            (when-not (nil? full-gc) 
              (writeln (process-full-gc (first full-gc))))
            (when-not (nil? minor-gc) 
              (writeln (process-minor-gc (first minor-gc))))))))))

;-----------------------------------------------------------------------   
; Convert Java GC log csv format
;-----------------------------------------------------------------------    
(process-gc-file "gc.log" "data.csv")

You can download the script directly here : gcanalysis.clj.
Monday, February 04, 2013

Java Garbage Collection Log Analysis with R

In the past, I generally perform Java GC log analysis using a combination of scripts such as the one I have written in my previous blog post for parsing the gc log and transforming it into csv format, GCHisto tool as mentioned in the book Java Performance, and Microsoft Excel for mostly plotting purposes. However, as I find myself doing more and more GC analysis for troubleshooting performance issues, I'm finding that these tools are not flexible enough for my purposes.

I heard about The R Project from one my coworker. In addition, I see R gaining traction in the industry; I decided to try using R for GC analysis. This blog post is to document some of my experiences with using R for GC analysis.

There are some posts in the blogosphere that seem to suggest that it is difficult to learn R. I did not find that to be the case. Whether that's due to knowing functional programming or past experience with Matlab, I don't know. I did purchase a bunch of books on R to learn it including R in a Nutshell, R by Example, R in Action, Introductory Statistics with R. I got the most mileage with the last book.

In working with R, I still would use a script to parse out raw GC log and converted into csv file. So far, most of my GC analysis are on non-CMS GC logs so this blog post is restricted to discussing analysis of mostly parallel GC logs. In order to be able to better read my R scripts, I have changed my script to output the csv file with the following headers:

timestamp,gc.type,young.start,young.end,young.max,heap.start,heap.end,heap.max,pause.time,old.start,old.end,old.max,perm.start,perm.end,perm.max,time.user,time.sys,time.real

I can load the csv file in R as follows:

data.file <- "gc.log.csv"
data.gc <- read.csv(data.file,sep=',')

I created the following utility functions because I find that I often want to work in MB or GB for heap space rather than in KB. Also, I want to work with timestamp in hours rather than seconds.

sec.to.hours  <- function(x) x/(60.0*60.0)
kb.to.mb <- function(x) x/1024.0
kb.to.gb <- function(x) x/1024.0^2

Printing GC Pause Time Statistics

With this, I can dump the GC pause time statistical information as follows:

# Dump mean, standard deviation, GC counts for GC pause time
attach(data.gc)
 by(pause.time,gc.type,mean)
 by(pause.time,gc.type,sd)
 by(pause.time,gc.type,length)

 # GC Frequency statistics
 summary(diff(timestamp))

 # Time spent in GC
 sum(pause.time)

 # Percentage of time spent in GC
 sum(pause.time)*100.0/max(timestamp)
 
detach(data.gc)

For the above code, a sample output would be:

# by(pause.time,gc.type,mean) output 
# GC Average Pause Time
gc.type: full
[1] 2.125116
-------------------------------------------------------------- 
gc.type: minor
[1] 0.06472383

# by(pause.time,gc.type,sd) output 
# GC pause time distribution
gc.type: full
[1] 1.01972
-------------------------------------------------------------- 
gc.type: minor
[1] 0.02684703

# by(pause.time,gc.type,length) output 
# GC count by type
gc.type: full
[1] 7
-------------------------------------------------------------- 
gc.type: minor
[1] 2172

# summary(diff(timestamp)) output 
# GC Frequency statistics - (e.g. GC occurs on average every 84 seconds)
   Min. 1st Qu.  Median    Mean 3rd Qu.    Max. 
   0.08   22.44   71.34   84.83  143.10  252.90 
   
# sum(pause.time) output
# Total time spent in GC   
[1] 155.456

# sum(pause.time)*100.0/max(timestamp) output 
# Percentage of time spent in GC
[1] 0.08412511

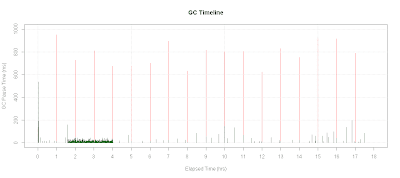
Plotting GC Timeline

Here's how to plot GC Timeline:

with(data.gc, {
 plot.title <-"GC Timeline"
 gc.minor <- pause.time[gc.type == "minor"]
 gc.full <- pause.time[gc.type == "full"]

 # Plot bars for full GC pause time 
 plot(sec.to.hours(timestamp[gc.type == "full"]),
   gc.full*1000.0,
   xlab="Elapsed Time (hrs)",
   ylab="GC Pause Time Time(ms)",type='h',
   main=plot.title,col="red",ylim=c(0,1000),xlim=c(0,18))
   
 # Plot bars for minor GC pause time
 lines(sec.to.hours(timestamp[gc.type == "minor"]),
       gc.minor*1000.0,col="dark green",type="h")

 # Set tick marks for every hour
 axis(1,seq(0,18,1))
 grid()
})

A sample output of the above code would be:

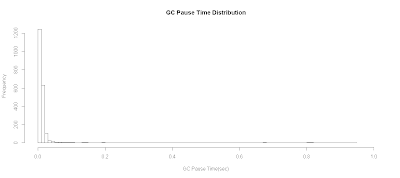
Plotting GC Pause Time Distribution

To plot GC pause time distribution:

# Plot GC Pause Time Distribution
plot.title <- "GC Pause Time Distribution"
with(data.gc, {
 hist(pause.time,breaks=100, 
   xlab="GC Pause Time(sec)",
   xlim=c(0,1.0),
   main=plot.title)
})

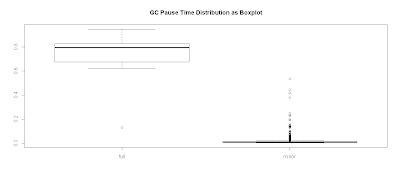
Plotting GC Pause Time Distribution as a Boxplot

Alternatively, you can view this as a boxplot:

plot.title <- "GC Pause Time Distribution as Boxplot"
with(data.gc, {
 boxplot(pause.time ~ gc.type,main=plot.title)
}) 

Plotting Promoted Heap Memory

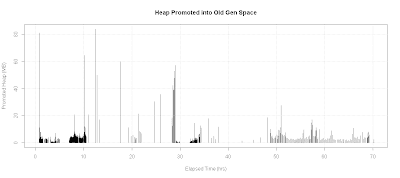
One particular case, I was analyzing a situation where minor GC pause time was unusually large. My original hypothesis is that a lot of memory was being promoted into old generation space. Therefore, I wanted a plot of heap memory promoted into old gen space:

plot.title <- "Heap Promoted into Old Gen Space"
with(data.gc, {
 old.end <- kb.to.mb(heap.end - young.end)
 x <- sec.to.hours(timestamp)
 # If there is a full GC, promoted heap size would go negative
 y <- diff(old.end)
 plot(x[-1],y,
   xlab="Elapsed Time (hrs)",
   ylab="Promoted Heap (MB)",type='h',
   main=plot.title)
 grid()
})

In this particular case, the promoted heap was not all that large as shown in the diagram below:

Plotting Young Gen Survived Heap

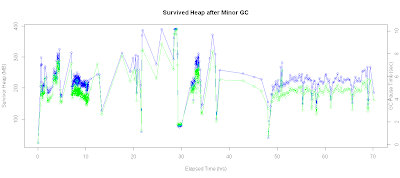
I then investigated survivor heap spaces. Here's the script that plots the survivor heap space along with GC pause time on the same chart:

# Plot survived Heap
xtitle <- 'Elapsed Time (hrs)'
ytitle <-'Survivor Heap (MB)'
plot.title <- "Survived Heap after Minor GC"

with(data.gc, {
   
 x <- sec.to.hours(timestamp)
 y <- kb.to.mb(young.end)
 plot(x,y,
  xlab=xtitle,ylab=ytitle,
  main=plot.title,type='o',col='blue')
  
 # Plot on secondary axis
 par(new=TRUE)
 plot(x,pause.time,
   axes=FALSE,type='o',
   col="green",pch=23,xlab="",ylab="")
 axis(4)
 mtext("GC Pause Time (sec)",4)
})

In addition, I can also check the correlation coefficient via :

> with(data.gc,cor(young.end[gc.type == 'minor'],pause.time[gc.type == 'minor']))
[1] 0.9659936

As we can see from the result, the correlation was pretty high that size of the survivor heap and its effect on GC pause time.

Checking for Memory Leaks

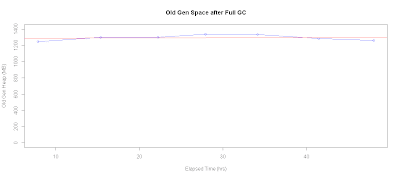
Another plot that I often have to generate is used as a quick check for memory leaks. Here's the R script that plots old gen heap space usage after every full GC:

# Check for memory leak
xtitle <- 'Elapsed Time (hrs)'
ytitle <-'Old Gen Heap (MB)'


with(data.gc, {
 plot.title <- "Old Gen Space after Full GC"
 x <- sec.to.hours(timestamp[gc.type=="full"])
 y <- kb.to.mb(old.end[gc.type=="full"])
 plot(x,y,
   xlab=xtitle,ylab=ytitle,main=plot.title,type='o',col='blue')

 # Add fitted line
 abline(lm(y ~ x),col="red")
 retval <<- lm(y ~ x)
})
retval

With the trend analysis line, we can potentially project when the system will run out of memory. For the following plot, checking the linear model fit along with eyeballing the chart suggests that we don't really have a memory leak issue:

Call:
lm(formula = y ~ x)

Coefficients:
(Intercept)            x  
   1285.978        0.298  

I am delighted by the power afforded by R to perform GC analysis. It has now become my preferred tool to perform GC analysis. In addition, because I learned how to use R, I'm beginning to use R in other capacity, including inventory , trending, and capacity planning analysis.

Monday, January 28, 2013

Checking Tibco EMS Queue Connected Users with Clojure

During our Tibco EMS infrastructure upgrade project, we had some rogue connections that just refused to disconnect from the old infrastructure and switch to the new Tibco EMS infrastructure. In order to track down these connections and evict those connections, I had to generate a report which would tell me which user, from which host is connected to particular queues in Tibco EMS. Here's the script that I wrote in Clojure that generates that report.

; Get destination users (and which host the user is connecting from) along with which queue/topic it is connected to.
(defn get-destination-users [server-url username password]
  (with-open [admin (TibjmsAdmin. server-url username password)]
    (let [connections  (.getConnections admin) 
          consumers    (.getConsumers admin)
          dest-userids (->> consumers
                         (map (fn [c] {:userid (.getConnectionID c) 
                                       :dest (.getDestinationName c)})))
          get-user (fn [dest-name id]
                     (let [conn (first (filter #(= id (.getID %)) connections))]
                       (if (nil? conn)
                         {:dest dest-name :user (str "Unknown user : " id) :host "unknown"}
                         {:dest dest-name :user (.getUserName conn) :host (.getHost conn)})))]
      (map (fn [x] (get-user (:dest x) (:userid x))) dest-userids))))

; Dump results in CSV format
(def results (get-destination-users server-url username password))   
(doseq [r (sort-by :user (set results))]
  (println  (str (:user r) "," (:host r) "," (:dest r))))

Monday, January 14, 2013

Who's Connecting to My Servers?

I have been reading through the book Clojure Programming. In the course of reading this book, I've looked for all sorts of opportunities to try applying Clojure at work. Most of the time, I've used Clojure to implement convenience scripts to help with my day job. I would typically use Clojure whenever I have to work with Java based platforms and F# for .NET based platforms. Occasionally, I would develop scripts that does not have any dependency and I could choose any language to implement. What would typically happen is that I would choose the programming language that I used last. This strategy, unfortunately, would typically end up biasing me toward one programming language and lately, it has been biasing me toward Clojure. After noticing this trend, I have decided to deliberately and consciously choose to implement in the less frequently used language so I don't become completely rusty in the other programming languages.

Recently, I had to opportunity to write a small script. I was managing an infrastructure upgrade and needed to know the downstream impact. It was an infrastructure component that that a lot of persistent inbound connections, but unfortunately, the inbound connections were neither monitored nor documented. One way to check the connections is ask the the network engineers to setup monitoring on the servers and collect the information on the incoming connections. Our network engineers are generally pretty busy and we hate to add to their existing workloads. However, we can effectively do the same thing by running netstat -an on each of the target servers and taking that output dump and parse that for incoming connections. We would do this over a period of time to try to capture most of the client connections.

The following Clojure script loads all the netstat dump output files and generate a list of all the hosts that are connected to the target servers:

(import '(java.net InetAddress))
(use '[clojure.string :only (join)])
(use '[clojure.java.io :as io])

; Load all the data from all *.data files in c:\work\servers folder
(def data (->> "c:\\work\\servers"
   (io/file)
   (file-seq)
   (map #(.getAbsolutePath %))
   (filter #(re-matches #".*\.data$" %))
   (map #(slurp %))
   (join " ")))

; Find all ip addresses in the netstat dump
; Perform hostname lookup, discard duplicates, sort the hostnames   
(def hosts (->> data
   (re-seq #"(\d{1,3}\.\d{1,3}\.\d{1,3}\.\d{1,3})\.\d+")
   (map #(second %))
   (set)
   (map #(.getCanonicalHostName (InetAddress/getByName %)))
   (sort)
   (join "\n")))

; Dump output to clients.out file
(spit "c:\\work\\servers\\results.out" hosts)

The above script runs with the assumption that all data fits into memory. However, if that becomes a problem, it is fairly trivial to sequentially read and process netstat dump one file at a time and combine the results to write to the output.

The F# version is similar to Clojure version. Grabbing the files from the folder is easier but the need to explicitly handle exceptions adds back the additional lines of code to be about on par with code verbosity of the Clojure version.

open System.IO
open System.Net
open System.Text.RegularExpressions

// Load all the data from all *.data files in c:\work\servers folder
let data = Directory.GetFiles(@"c:\work\servers","*.data")
           |> Seq.map File.ReadAllText
           |> String.concat " "

// Return hostname if it can be resolved
// otherwise return the ip address
let getHostEntry (ipaddress:string) =
    try
        Dns.GetHostEntry(ipaddress).HostName
    with
      | err -> ipaddress

// Find all ip addresses in the netstat dump
// Perform hostname lookup, discard duplicates, sort the hostnames
let hosts = Regex.Matches(data,@"(\d{1,3}\.\d{1,3}\.\d{1,3}\.\d{1,3})\.\d+")
            |> Seq.cast<Match>
            |> Seq.map (fun m -> m.Groups.[1].Value)
            |> Set.ofSeq
            |> Seq.map getHostEntry
            |> Seq.sort
            |> String.concat "\n"

File.WriteAllText(@"c:\work\servers\results.out",hosts)

Monday, June 11, 2012

Quick and easy way to monitor for memory leaks in Java application servers

I was part of a postmortem analysis team that performed a root cause analysis on why a particular node in a HA paired system failed and needed to provide recommendations to prevent future occurrences. Initial examination of the log showed that the node that failed had a permgen out of memory problem. Management team also wanted to know if there were memory leaks with the application.

Unfortunately, the Java application server was not configured with GC logging nor configured to perform a heap dump on out of memory error condition. Without the gc log data or the heap dump, it becomes harder to be able to explain why did the application server run out of permgen space at the time it failed. In the interest of collecting data and to prevent future node failures, we recommended that permgen space be increased and add the following startup parameters to the Java application server

    -XX:+PrintGCTimeStamps
    -XX:+PrintGCDetails
    -XX:+HeapDumpOnOutOfMemoryError
    -XX:HeapDumpPath=/myapp/heapdumps
    -Xloggc:/myapp/logs/gc.log

One problem that arose during the writeup of the analysis was how to answer the question whether the application had any memory leak issue. The application team could not reproduce the problem in non-production environment but wanted some assurance that the application did not have a memory leak problem with PermGen space or anywhere else in the heap. I proposed that we track heap usage after every Full GC over a period of time and see the heap usage trends over time. The heap usage trends should provide a good indication if the application has a problematic memory leak issue or not.

In order to do so, I wrote a small script to parse out only the heap and permgen space info after a full GC from the gc log. I wrote this script in Clojure as follows:

; Define the regex pattern to parse each line in gc log
(defn full-gc-pattern []
    (let [timestamp  "([\\d\\.]+): .* " 
          space      "(\\d+)K->(\\d+)K\\((\\d+)K.+ "
          new-gen    space
          old-gen    space
          perm-gen   space
          heap       "(\\d+)K->(\\d+)K\\((\\d+)K\\)\\], "
          exec-stat  "(\\d+\\.\\d+).*" ]
         (re-pattern (str timestamp new-gen old-gen perm-gen heap exec-stat))))                 

; We only want to dump timestamp, total heap and perm gen space
; after each full GC
; Variable definitions:
;     ts - timestamp (in seconds)
;     ys - YoungGen space starting heap size (in KB)
;     ye - YoungGen space ending heap size (in KB)
;     ym - YoungGen space max heap size (in KB)
;     os - OldGen space starting heap size (in KB)
;     oe - OldGen space ending heap size (in KB)
;     om - OldGen space max heap size (in KB)
;     hs - Total heap space starting heap size (in KB)
;     he - Total heap space ending heap size (in KB)
;     hm - Total heap space max heap size (in KB)
;     ps - PermGen space starting heap size (in KB)
;     pe - PermGen space ending heap size (in KB)
;     pm - PermGen space max heap size (in KB)
(defn process-full-gc [entry]
    (let [parsed (first (re-seq (full-gc-pattern) entry))
         [a ts ys ye ym os oe om hs he hm ps pe pm & e] parsed]
        (println (format "%s,%s,%s" ts he pe))))

; Load the gc log data
(def gcdata (line-seq (clojure.java.io/reader (clojure.java.io/file "gc.log"))))
        
; Process each full GC entry after filtering out minor GC entries          
(doseq [line (keep #(re-find #".*Full GC.*" %) gcdata)]
    (process-full-gc line))

Using this script against the gc log file, and taking that output and loading into a spreadsheet, I can plot and generate a trendline to see if memory is growing or not. Here's the heap usage plot over approximately a month.

As seen on the chart, the slope of the trendlines are small and negative, which is a good indicator that we do not have a memory leak problem with this application.

Monday, May 28, 2012

Character Encoding Troubles

In the past, I encountered an issue with a legacy application that migrated from WebLogic Server running on a old Windows server to a newer Tomcat application server running on Red Hat Linux environment. This application has been running fine without issues for weeks until the developer suddenly started to complain that this application is not saving the registered ® and copyright © trademark symbols to the database. The developer also said that when he runs the application from his Windows laptop, he's able to save these two symbols into the database.

Earlier in my career, I was developer for a software company that built multilingual software specializing in Asian languages, I recognize this as a character encoding issue. So I asked the developer to send me the source code related to this issue and here's the relevant part of the code:

    // Sending updates to the database
    update.setValue("data",encodeString(text));
    // Inserting the data to the database
    insert.setValue("data",encodeString(text));

That seemed odd, what does the method encodeString do? Here's the implementation:

public String encodeString(String value) throws java.io.UnsupportedEncodingException
{
  log("encodeString", "Begin");
  if (value == null)
  {
    log("encodeString", "value == null");
    return value;
  }
  
  byte [] btValue = value.getBytes();
  String encodedValue = new String(btValue, _ISO88591);
  
  /*
  Charset utf8charset = Charset.forName("UTF-8");
  Charset iso88591charset = Charset.forName("ISO-8859-1");

  ByteBuffer inputBuffer = ByteBuffer.wrap(btValue);

  // decode UTF-8
  CharBuffer data = utf8charset.decode(inputBuffer);

  // encode ISO-8559-1
  ByteBuffer outputBuffer = iso88591charset.encode(data);
  byte[] outputData = outputBuffer.array();
  byte[] inputData = inputBuffer.array();
 
  log("ISO-8859-1: ", new String(outputData));
  log("UTF-8: ", new String(inputData));
  
  //String encodedValue = new String(btValue, _ISO88591);
  String encodedValue = new String(inputData);
  String encodedValue_ISO88591 = new String(inputData, _ISO88591);
  //encodedValue.getBytes("UTF-8");
  log("Encoded UTF: ", encodedValue);
  log("Encoded ISO88591: ", encodedValue_ISO88591);
  */
  
  return encodedValue;
}

Wow! I can see that the developer is trying to get a handle on this encoding business and hence all the commented out R&D code, but clearly this developer is not familiar with character set encoding issues.

The main problem is with the following line of code:

  byte [] btValue = value.getBytes();

From Java API manual, the getBytes() method encodes the string into a sequence of bytes using the platform's default charset. On the old legacy Windows Server that this application was originally running on, it was probably using Windows code page 1252, which is basically ISO-8859-1 and hence the register and copyright symbols were correctly encoded. However, on the Red Hat Linux operating system, the default encoding was ascii and therefore the register/copyright symbol got converted into question marks.

Java strings are internally unicode (UTF-16) and typically the JDBC drivers will provide the appropriate conversions to and from the database. Therefore, fix to this application is simple, all one have to do is merely change the following two lines of code and get rid of the entire encodeString() method:

    // Changed from : update.setValue("data",encodeString(text));
    update.setValue("data",text);
    // Changed from : insert.setValue("data",encodeString(text));
    insert.setValue("data",text);

Monday, April 30, 2012

F#, Clojure and Message Queues on Tibco EMS

It looks like I will be getting much more hands on with Tibco EMS. Since the Tibco EMS system in use will have connections from both .NET platforms and Java platforms, I wanted to write some scripts to run some engineering tests on Tibco EMS. I decided to simulate .NET side connections with F# and Java side connections with Clojure. Taking the sample code from Tibco installation, I created the following F# script that sends messages to a queue from the sample C# code:

#r @"C:\tibco\ems\6.3\bin\TIBCO.EMS.dll"

open System
open TIBCO.EMS

let serverUrl = "tcp://localhost:7222"
let producer = "producer"
let consumer = "consumer"
let password = "testpwd"
let queueName = "testQueue"


let getQueueTextMessages serverUrl  userid password queueName messageProcessor =
    async {
        let connection = (userid,password)
                         |> (new QueueConnectionFactory(serverUrl)).CreateQueueConnection
        let session = connection.CreateQueueSession(false,Session.AUTO_ACKNOWLEDGE)
        let queue = session.CreateQueue(queueName)
        let receiver =  session.CreateReceiver(queue)
        connection.Start()
        printf "Queue connection established!"
        while true do
            try
                receiver.Receive() |> messageProcessor
            with _ ->  ()
    }


let sendQueueTextMessages serverUrl  userid password queueName messages =
    let connection = (userid,password)
                     |> (new QueueConnectionFactory(serverUrl)).CreateQueueConnection
    let session = connection.CreateQueueSession(false,Session.AUTO_ACKNOWLEDGE)
    let queue = session.CreateQueue(queueName)
    let sender = session.CreateSender(queue)
    connection.Start()

    messages
    |> Seq.iter (fun item -> session.CreateTextMessage(Text=item)
                             |> sender.Send)
                             
    connection.Close()


// Just dump message to console for now
let myMessageProcessor (msg:Message) =
    msg.ToString() |> printf "%s\n"


let consumeMessageAsync = getQueueTextMessages "tcp://localhost:7222" "consumer" "testpwd"
let produceMessages queueName messages = sendQueueTextMessages "tcp://localhost:7222" "producer" "testpwd" queueName messages 

// Start message consumer asynchronously
Async.Start(consumeMessageAsync "testQueue" myMessageProcessor)


// Send messages to the Tibco EMS   
[ "Aslund"; "Barrayar"; "Beta Colony"; "Cetaganda"; "Escobar"; "Komarr"; "Marilac"; "Pol"; "Sergyar"; "Vervain"]
|> produceMessages "testQueue"

The queue consumer is implemented asynchronously so it won't block executing subsequent statements. To test Tibco JMS from Java, here is the equivalent Clojure code:

(import '(java.util Enumeration)
        '(com.tibco.tibjms TibjmsQueueConnectionFactory)
        '(javax.jms Message JMSException  Session
                    Queue QueueBrowser 
                    QueueConnection QueueReceiver 
                    QueueSession QueueSender))
                  
(def serverUrl "tcp://localhost:7222")
(def producer "producer")
(def consumer "consumer")
(def password "testpwd")
(def queueName "testQueue")

; Consume Queue Text messages asynchronously
(defn get-queue-text-messages [server-url user password queue-name process-message]
    (future
        (with-open [connection (-> (TibjmsQueueConnectionFactory. server-url)
                                   (.createQueueConnection user password))]
            (let [session (.createQueueSession connection false Session/AUTO_ACKNOWLEDGE)
                  queue (.createQueue session  queue-name)]
                (with-open [receiver (.createReceiver session queue)]              
                    (.start connection)
                    (loop []                       
                        (process-message (.receive receiver))
                        (recur)))))))
                   
; Send multiple Text messages
(defn send-queue-text-messages [server-url user password queue-name messages]
    (with-open [connection (-> (TibjmsQueueConnectionFactory. server-url)
                               (.createQueueConnection user password))]
        (let [session (.createQueueSession connection false Session/AUTO_ACKNOWLEDGE)
              queue (.createQueue session  queue-name)
              sender (.createSender session queue)]
            (.start connection)
            (doseq [item messages]
                (let [message (.createTextMessage session)]
                    (.setText message item)
                    (.send sender message))))))


; Create function aliases with connection information embedded                    
(defn consume-messages [queue-name message-processor]
    (get-queue-text-messages  serverUrl producer password queue-name message-processor))

(defn produce-messages [queue-name messages]
    (send-queue-text-messages  serverUrl producer password queue-name messages))

; Just dump messages to console for now
(defn my-message-processor [message]
    (println (.toString message)))

    
; Start consuming messages asynchronously
(consume-messages "testQueue" my-message-processor)                            

; Send messages to queue
(def my-messages '("alpha" "beta" "gamma" "delta"
                   "epsilon" "zeta" "eta" "theta"
                   "iota" "kappa" "lambda" "mu" "nu"
                   "xi", "omicron" "pi" "rho"
                   "signma" "tau" "upsilon" "phi",
                   "chi" "psi" "omega"))                    

(produce-messages  "testQueue"  my-messages)    

With these scripts, I can easily swap in different message generators and message processors as needed for any testing purposes. When I fired up both these scripts up to the part where queue consumers are running in both F# and Clojure version and then send the messages, I could see that Tibco EMS send half the messages to my F# script and the other half to my Clojure script. Since both of these scripts run in REPL environment, I can easily adjust my level of testing as I get results.

Tuesday, March 06, 2012

Adventures in troubleshooting out of memory errors with Coherence cluster.

One day, an application team manager called me and said that their application caused an out of memory error condition in their Oracle Coherence cluster. This same code base ran in the old Coherence 3.1 environment for months without running into out of memory conditions and now is failing in the new Coherence 3.6 environment in matter of a few weeks on a regular basis. He said that he had heap dumps and logs and asked whether I could take a look at it and troubleshoot it.

Initially, I was skeptical about being able to help this team manager out. After all, I know almost nothing about their application code and in all practical terms, I had no previous development experience with Coherence with the exception that I read the book Oracle Coherence 3.5 by Aleksandar Seovic in the past. My previously participated in testing Coherence performance on VMware and that really did not require me to delve into the Coherence API at all.

Despite these misgivings, I decided to provide my support and told the application team manager that I'll try my best.

The system with problems was a multi-node Coherence cluster. When I took a look at the logs, all of them had these similar verbose GC output:

[GC [1 CMS-initial-mark: 1966076K(1966080K)] 2083794K(2084096K), 0.1923110 secs] [Times: user=0.18 sys=0.00, real=0.19 secs] 
[Full GC [CMS[CMS-concurrent-mark: 1.624/1.626 secs] [Times: user=3.22 sys=0.00, real=1.62 secs] 
 (concurrent mode failure): 1966079K->1966078K(1966080K), 6.6177340 secs] 2084093K->2084082K(2084096K), [CMS Perm : 13617K->13617K(23612K)], 6.6177900 secs] [Times: user=8.21 sys=0.00, real=6.62 secs] 
[Full GC [CMS: 1966078K->1966078K(1966080K), 4.1110330 secs] 2084093K->2084089K(2084096K), [CMS Perm : 13617K->13615K(23612K)], 4.1111070 secs] [Times: user=4.11 sys=0.00, real=4.11 secs] 
[Full GC [CMS: 1966078K->1966078K(1966080K), 4.2973090 secs] 2084092K->2084087K(2084096K), [CMS Perm : 13615K->13615K(23612K)], 4.2973630 secs] [Times: user=4.28 sys=0.00, real=4.30 secs] 
[Full GC [CMS: 1966078K->1966078K(1966080K), 4.1831450 secs] 2084093K->2084093K(2084096K), [CMS Perm : 13615K->13615K(23612K)], 4.1831970 secs] [Times: user=4.18 sys=0.00, real=4.18 secs] 
[Full GC [CMS: 1966078K->1966078K(1966080K), 4.2524850 secs] 2084093K->2084093K(2084096K), [CMS Perm : 13615K->13615K(23612K)], 4.2525380 secs] [Times: user=4.24 sys=0.00, real=4.25 secs] 
java.lang.OutOfMemoryError: Java heap space
Dumping heap to java_pid23607.hprof ...
Heap dump file created [2274434953 bytes in 28.968 secs]

This garbage collection log output tells me that they are using CMS for the JVM GC. The concurrent mode failure entries certainly grabbed my attention. Normally one would fix concurrent mode failures by tuning the CMS initiation occupancy fraction via -XX:CMSInitiatingOccupancyFraction flag, but in this case, looking that the heap numbers in the lines labeled "Full GC" showed that GC could not clean up any memory at all. So this problem could not be solved by GC tuning. By the way, for a great book on tuning garbage collection, I would recommend Charlie Hunt's book Java Performance.

My next step was to take a look a the heap. The heap was slightly over 2 GB, which was expected since Coherence cluster node was each configured with a 2GB heap. Well, that presented a problem for me because I'm still mainly working on a 32-bit Windows laptop. I needed to find a 64-bit system with preferably 4 GB of ram or more to look at this. Once I was able to get such a machine and fired up Eclipse Memory Analyzer Tool (MAT). Once I looked at the heap, it was pretty obvious what was the biggest memory offender. The biggest memory offender was a top level hashmap chewing up 1.6 GB of memory. Delving further into that hash map structure, it reveals that Coherence caching structure is a hash of hashes. Looking at the hashes, I notice that there were over 2000+ items in the top level hash. That would imply that there were over 2000+ caches in the Coherence cluster. Studying each individual cache, I would notice cache names like

  • alpha-FEB-21
  • alpha-FEB-22
  • alpha-FEB-23
  • alpha-FEB-24
  • beta-FEB-21
  • beta-FEB-22
  • beta-FEB-23
  • beta-FEB-24

and so forth. I ask the application team manager whether he expected to have this many caches in the cluster. The application team manager said no; he expected a much smaller set of caches. The application normally destroy caches older than 2 days. The developers provided me their code related to the creation and destruction of caches and I saw the following lines of code and it seems pretty innocuous:

    public static void destroyCache(String name) {
        Collection listOfCacheNames = getListOfCacheNames(name, false);
        Iterator iterator = listOfCacheNames.iterator();
        while (iterator.hasNext()) {
            String name = (String) iterator.next();
            NamedCache namedCache = CacheFactory.getCache(name);
            namedCache.destroy();
        }
    }

I went back to the memory analyzer tool and performed a GC to root analysis and saw the top level object that's holding onto this heap as:

com.tangosol.coherence.component.net.Cluster$IpMonitor @ 0x77ff4b18 

with the label "Busy Monitor" next to it. This line item seems to suggest that there's a monitor lock on this cache. Looking at the Coherence API documentation, I see the following entry:


destroy

void destroy()
Release and destroy this instance of NamedCache.

Warning: This method is used to completely destroy the specified cache across the cluster. All references in the entire cluster to this cache will be invalidated, the cached data will be cleared, and all internal resources will be released.

Caches should be destroyed by the same mechansim in which they were obtained. For example:

  • new Cache() - cache.destroy()
  • CacheFactory.getCache() - CacheFactory.destroyCache()
  • ConfigurableCacheFactory.ensureCache() - ConfigurableCacheFactory.destroyCache()
Except for the case where the application code expicitly allocated the cache, this method should not be called by application code.

Looking at this documentation, we initially thought that since the cache was obtained via CacheFactory and therefore should be destroyed via CacheFactory ergo CacheFactory had a monitor lock on the underlying collections. The code provided by the developers used one mechanism to create the cache and another mechanism to destroy the cache so we presume that was the problem. So I implemented a test script to test out that theory and surprisingly, even destroying via CacheFactory, I still encounter out of memory issues. Only by clearing the cache before destroying the cache was I able to avoid out of memory errors. Here's the script that I developed in Clojure to test my theories:

(import '(org.apache.commons.lang3 RandomStringUtils) 
        '(java.math BigInteger)
        '(java.util Random Date HashMap)
        '(com.tangosol.net NamedCache CacheFactory CacheService Cluster))

(defn random-text [] (RandomStringUtils/randomAlphanumeric 1048576))
(defn random-key [] (RandomStringUtils/randomAlphanumeric 12))
        
(CacheFactory/ensureCluster)
(def buffer (new HashMap))

(defn print-horizontal-line [c] (println (apply str (repeat 80 c))))

(def caches '("alpha" "beta" "gamma" "delta" 
              "epsilon" "zeta" "eta" "theta" 
              "iota" "kappa" "lambda" "mu" "nu"
              "xi", "omicron" "pi" "rho"
              "signma" "tau" "upsilon" "phi", 
              "chi" "psi" "omega"))

(defn load-cache [cache-name n]
    (let [cache (CacheFactory/getCache cache-name)]
         (print-horizontal-line  "=")
         (println "Creating cache : " cache-name)
         (print-horizontal-line  "=")         
         (.clear buffer)
         (dotimes [_ n] (.put buffer (random-key) (random-text)))
         (.putAll cache buffer)))


(defn recreate-oom-problem [cache-name]
    (let [cache (CacheFactory/getCache cache-name)]
         (load-cache cache-name 200)
         (.destroy cache)))
         
(defn try-fix-oom-1 [cache-name]
    (let [cache (CacheFactory/getCache cache-name)]
         (load-cache cache-name 200)
         (CacheFactory/destroyCache cache)))

(defn try-fix-oom-2 [cache-name]
    (let [cache (CacheFactory/getCache cache-name)]
         (load-cache cache-name 200)
         (.clear cache)
         (CacheFactory/destroyCache cache)))
         
; Test run recreation of original problem.  Was able to reproduce OOM issues         ; 
(doseq [cache caches] (recreate-oom-problem cache))

; Surprise! Still have OOM issues
(doseq [cache caches] (try-fix-oom-1 cache))

; No longer have OOM issues, but memory is still leaking (slowly)
(doseq [cache caches] (try-fix-oom-2 cache))
         

However, I still suspect memory leaks, it's just that my memory leak is a lot smaller now. To verify that I had a memory leak, I would run my Clojure test script and the deliberately create and fill a cache without clearing it. I then forced a full garbage collection followed by a heap dump. In memory analyzer tool, I would look up the cache that I did not clear, and list all the incoming references. Then I would look for a HashMap in the incoming references and select one of those and check for outgoing references. And in that outgoing references, I could see that the key contains the name of a cache that I had called CacheFactory.destroyCache() on and the retained heap sizes range anywhere from 24 to 160 with the sizes that seems proportional to the size of the cache name.

In conclusion, it would seem Oracle Coherence does have a memory leak issues with the cache creation and destruction process. If we clear the cache before destroying the cache, I suspect it would be a long time before the memory leak is even noticeable by this particular application.

To verify that this leak did not exist in the older 3.1 version, we ran this test code on and and was unable to reproduce the out of memory errors. We also tested this against Oracle Coherence 3.7.1 and was unable to reproduce the out of memory error. So, it looks like that this memory error is specific to Oracle Coherence 3.6 only.

Throughout this entire process, I thought that the secret sauce that enabled me to quickly learn Coherence, reproduce and troubleshoot the Coherence out of memory problem was Clojure. Clojure allowed me to interactively manipulate Coherence clusters and explore the API, which would have been a lot slower if I had to go through the normal edit-compile-run cycle with plain old Java.

Saturday, February 04, 2012

Detect multiple occurrences of Java classes in jar files

A developer came to me for help and said that a recent upgrade to a newer Java library broke the code. The developer was getting was a class not found exception. The developer said that the old jar file was replaced with a newer jar file. I know this same library upgrade in other applications did not have any problems, so this sounded like an issue with duplicate occurrence of the same class in the classpath. Since my Ruby Programming Language book was in handy access when this developer came to me, I ended up writing a small ruby script that went through all the jar files packed in the web archive and dumped an output of the fully qualified class along with the jar file that it can be found in and a count of the number of occurrences. Here's the ruby script running on a Windows platform:

java_home="C:\\sdk\\jdk1.6.0_24\\bin"

classmaps = Hash.new(0)

Dir["*.jar"].each do |file|
  cmd = sprintf("%s\\jar  -tf %s",java_home,file)
  lines = `#{cmd}`
  lines.each do |line|
    if line =~ /.class/
      key = line.chomp
      if classmaps.key?(key) then
        old = classmaps[key]
        data = sprintf("%s,%s",old,file)
        classmaps[key] = data 
      else
        classmaps[key] = file
      end
    end
  end
end


classmaps.each do |k,v|
    tokens = v.split(",")
    printf("%s,%i,%s\n",k,tokens.size,v)
end

I then loaded the output file in csv format into Excel and sorted the occurrences in descending order and was flabbergasted to find numerous entries that look something like the following entry:

Class NameOccurrenceFound in Jar files:
kodo/jdo/KodoExtent.class6mylib.jarmylib.jarmylib.jarkodo-api.jarkodo-runtime.jarkodo.jar

Somehow, for this application team, they were able to add the same class to the same jar file multiple times. I never thought that it was possible to add the same class to the same jar file multiple times nor would I ever want to do that. When I finally confronted the application team about this, they recognize that their build process is broken and need to fix their build process. But as a quick test, the developer removed some of the duplicate classes related to the library upgrade and the problems went away. Until Java 8 is introduced with Modularity capabilities, this tool has will be a handy way for me to check duplicate classes given a list of jar files.

Monday, August 30, 2010

Exploring Java AES encryption algorithm with Clojure

Encryption is one of those library that I use infrequently. It seems that every time I need to work with some encryption algorithm, it passes memory expiration date of my last implementation usage of some encryption algorithm. Recently, I had to implement some password encryption tool in Java and again, I had to revisit Java’s encryption library. In the past, for exploring unfamiliar libraries, I would normally write some code sprinkled with print statements, compile it and run the compiled code and adjust my code afterwards. But in the past couple years, I’ve become a big fan of REPL development environment for purposes of library exploration. In the .NET environment, I would use F# Interactive, Ruby & Python have their own REPL environment. For Java, I could have picked either Groovy or Clojure. I’ve scripted Groovy in the past and certainly liked the shorthand expressions to a lot of the Java code. However, I have heard a lot of positive blog posts about Clojure such that I wanted to try it out.

I never had the chance to program in Lisp in the past. But I have read some of Paul Graham’s articles which seems to make Lisp a programmer’s great secret weapon in becoming a better than average programmer. So I figure Clojure can get my feet wet with another variant of Lisp and help me accomplish my day job goals at the same time. The hardest part about learning Clojure was learning the API. The program structure was not hard to figure out. I used an RPN based HP 11C calculator while in college and Clojure program structure reminds me a lot of working with RPN calculators (albeit with a lot more parenthesis). Once I got the hang of the basic Clojure syntax, it became a great environment to work in. I would define a function, run the code and then interactively explore properties or call methods. After exploring in Clojure, it became fairly trivial task to translate that to the Java code.

While it was certainly fun to work in Clojure, I'm not sure I can substantiate Paul Graham's claim that knowing Lisp makes you a better than average programmer. Maybe it's more of the concept that a polyglot programmer generally makes a better programmer simply because the programmer that goes and learns multiple programming languages has a self driven desire to become a better programmer and therefore becomes a better programmer. I'll leave that discussion to the programmer philosophers out there and return to the more pragmmatic code construction.

Here’s the prototype AES encryption code in Clojure:

(import (javax.crypto KeyGenerator SecretKey Cipher))
(import (javax.crypto.spec SecretKeySpec))
(import (java.io File FileOutputStream DataInputStream FileInputStream))
(import (java.util Properties))
(import (org.apache.commons.codec.binary Base64))

(def msg "Hello encryption world!")
(defn encode-base64 [raw] (. (new Base64) encode raw))
(defn decode-base64 [coded] (. (new Base64) decode coded))

(def aes (. KeyGenerator getInstance "AES"))
(def cipher (. Cipher getInstance "AES"))
(def encrypt (. Cipher ENCRYPT_MODE))
(def decrypt (. Cipher DECRYPT_MODE))

(defn writekey [rawkey filename]     
    ( let [out (new FileOutputStream (new File filename))]
          (do (. out write rawkey)
              (. out close))))
    
(defn readkey [filename]
    (let [file (new File filename)
          rawkey (byte-array (. file length))
          in  (new DataInputStream (new FileInputStream file))]
          (do (. in readFully rawkey)
              (. in close)
              rawkey
          )))
          
(defn get-propfile [filename]   
    (let [prop (new Properties)]
        (do (. prop load (new FileInputStream filename)))
        prop))
    

(defn genkey [keygen] 
    (do (. keygen init  128)
        (. (. keygen generateKey ) getEncoded)
    )
)    
    
(defn do-encrypt [rawkey plaintext]
    (let [cipher (. Cipher getInstance "AES")]
        (do (. cipher init encrypt (new SecretKeySpec rawkey "AES"))
            (. cipher doFinal (. plaintext getBytes)))))
    
(defn do-decrypt [rawkey ciphertext]
    (let [cipher (. Cipher getInstance "AES")]
        (do (. cipher init  decrypt (new SecretKeySpec rawkey "AES"))
            (new String(. cipher doFinal ciphertext)))))
            
            
(defn get-password [key rawkey filename]
    (let [ props (get-propfile filename)
           coded (. props getProperty key)
           cipher (decode-base64 coded)]
         (do (do-decrypt rawkey cipher))))
         
(comment "Example usage"
(get-password "jms" (readkey "test.key") "data.out")
)         

Thursday, January 08, 2009

Hosting Silverlight Applications on Apache Web Server

My previous posting prompted a reader to ask me why I'm hosting my Silverlight application on IIS on Windows Server 2008. I did not have a good answer for that. I simply chose Windows Server 2008 because I wanted to install Windows 2008 Server and play around in that environment. In retrospect, it was a good first choice as it allowed to build and deploy Silverlight application with the least amount of fuss and configuration. That success encourage me to explore building Silverlight application further.

However, recently I've been investigating this hosting issue more and fortuitously discover Chris Craft's blog entry on hosting Silverlight application. All I needed was to register additional mime types! I immediately went and added the following mime types to my Apache Web Server:

manifestapplication/manifest
.xamlapplication/xaml+xml
.dllapplication/x-msdownload
.applicationapplication/x-ms-application
.xbapapplication/x-ms-xbap
.deployapplication/octet-stream

Now I can run my Silverlight application from an Apache web server! It wasn't until now that I realize that the Silverlight application runs entirely on the client. That means that I no longer need to develop the middle tier with .NET technology and can easily have my Silverlight application interact with a Java middle tier. For work environments that mandate Java middle tier, I can now promote Silverlight as a presentation tier solution.

Thursday, July 19, 2007

Create a minimalist Apache Struts 2.0 web application with Eclipse

I was recently asked by a colleague what I know about Apache Struts 2.0. I know that Apache Struts 2.0 was heavily redesigned and incorporated many elements of WebWork into it, but I don't have first hand experience with it. So I decided to start looking into it and get some first hand experience with Struts 2.0. This blog entry documents my first attempt at building a minimalist Struts 2.0 web application to be used as blank template for future web applications.

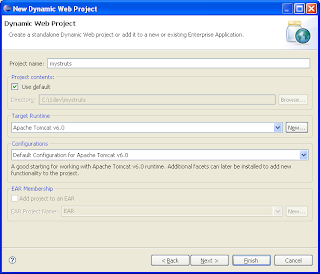
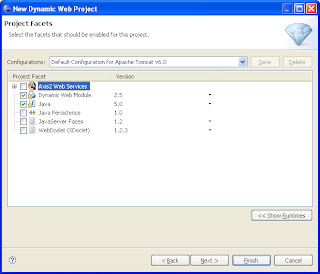
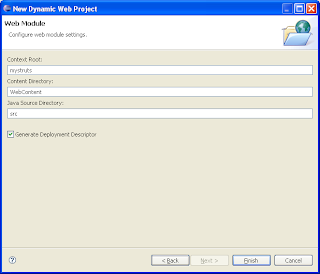
I started out by creating a new dynamic web project in Eclipse

I then copied over the following jar files into <project root>\WebContent\WEB-INF\lib folder (you can find these jar files in the struts blank application) :

  • antlr-2.7.2.jar
  • commons-logging-1.1.jar
  • freemarker-2.3.8.jar
  • ognl-2.6.11.jar
  • struts2-core-2.0.8.jar
  • xwork-2.0.3.jar

I replaced the Eclipse autogenerated web.xml with the following content:

<?xml version="1.0" encoding="UTF-8"?>
<web-app id="WebApp_9" version="2.4" 
 xmlns="http://java.sun.com/xml/ns/j2ee" 
 xmlns:xsi="http://www.w3.org/2001/XMLSchema-instance" 
 xsi:schemaLocation="http://java.sun.com/xml/ns/j2ee http://java.sun.com/xml/ns/j2ee/web-app_2_4.xsd">

    <display-name>My Sample Strust Web Application </display-name>

    <filter>
        <filter-name>struts2</filter-name>
        <filter-class>org.apache.struts2.dispatcher.FilterDispatcher</filter-class>
    </filter>

    <filter-mapping>
        <filter-name>struts2</filter-name>
        <url-pattern>/*</url-pattern>
    </filter-mapping>

    <welcome-file-list>
        <welcome-file>index.html</welcome-file>
    </welcome-file-list>

</web-app>

This web.xml file tells the tomcat server to apply the master Struts filter to all resources on the server. The FilterDispatch filter does the following

  • Execute actions
  • Clean up ActionContext (can cause problems with SiteMesh)
  • Serve static content
  • Start XWork's interceptor chain for the request cycle

I created the file struts.xml and put it in the <project root>\src folder with the following content :

<?xml version="1.0" encoding="UTF-8" ?>
<!DOCTYPE struts PUBLIC
    "-//Apache Software Foundation//DTD Struts Configuration 2.0//EN"
    "http://struts.apache.org/dtds/struts-2.0.dtd">

<struts>

    <constant name="struts.enable.DynamicMethodInvocation" value="false" />
    <constant name="struts.devMode" value="true" />

    <include file="example.xml"/>

    <!-- Add packages here -->

</struts>

The parameter struts.enable.DynamicMethodInvocation is to enable backward compatibility with WebWork 2. I would set this to false for new web applications. If I enable struts.devMode by setting it to true, I get the following:

  • Resource bundles are reloaded on every request. Which means you can change your properties file and see the changes on the next request.
  • Xml configuration files, validations files are reloaded on every request.
  • Exceptions will be thrown to normally ignorable problems.
  • Remember to turn this off in production!

Since I'm testing this out in development mode, I would set it to true. As you have probably noticed in the struts.xml file, I separated the application configuration to the include file example.xml. We'll begin with a basic example of hello world.

I created the file example.xml in the folder into <project root>\src with the following content :

<?xml version="1.0" encoding="UTF-8" ?>
<!DOCTYPE struts PUBLIC
        "-//Apache Software Foundation//DTD Struts Configuration 2.0//EN"
        "http://struts.apache.org/dtds/struts-2.0.dtd">

<struts>

    <package name="examples" namespace="/examples" extends="struts-default">

 <!--  Hellow world example -->
        <action name="HelloWorld">
            <result>/examples/helloworld.jsp</result>
        </action>

        <!-- Add actions here -->
    </package>
</struts>

For those of you who had experiences with Struts 1.x, notice how sensible defaults shorten the configuration significantly. If we do not specify the class attribute in the action tag, it defaults automatically to the default ActionSupport class, which always returns success. If we do not explicitly name the results tag, it defaults to "success" automatically. These sensible defaults allows us to write the above minimalist configuration file.


        <action name="HelloWorld">
            <result>/examples/helloworld.jsp</result>
        </action>

Compare the above configuration with an equivalent Struts 1.x configuration:

        <action path="/examples/HelloWorld"
                name="HelloWorld"
                type="examples.HelloWorldAction"
                validate="false"
            <forward name="HelloWorld" path="/examples/helloworld.jsp" />
        </action>

On top of the extra configuration, I would have also needed to implement HelloWorldAction class.

Testing out the code, I get :

Voila! I have my minimalist Struts 2.0 web application.